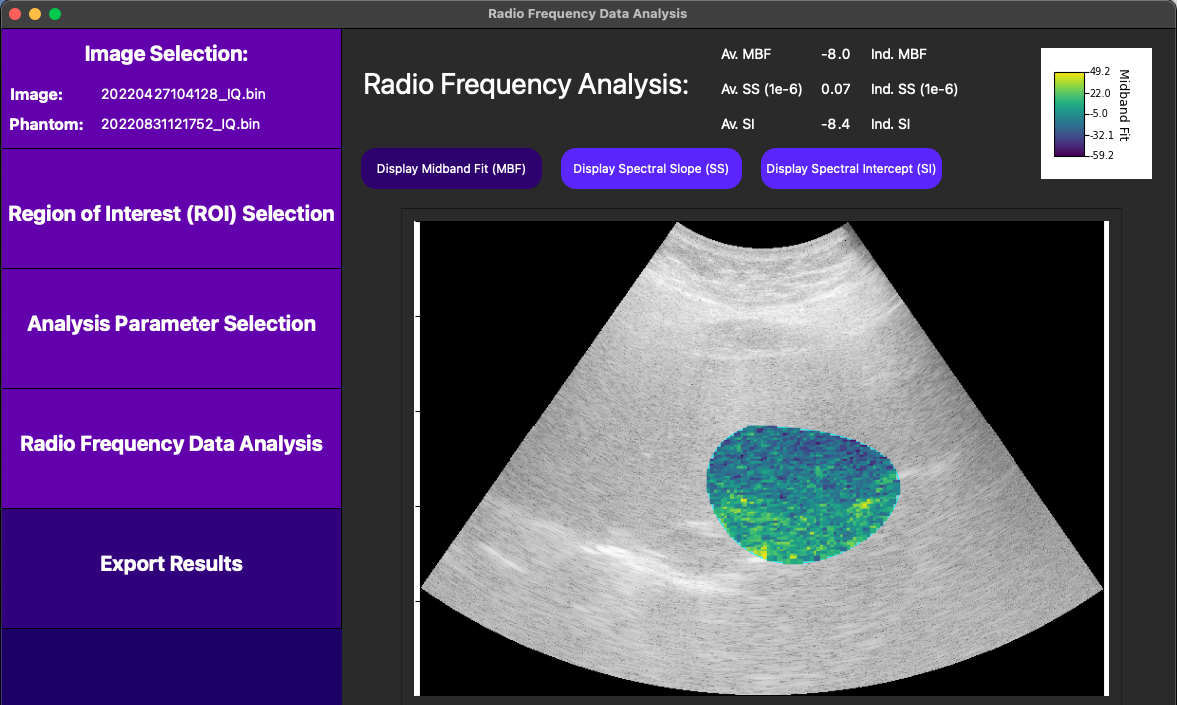
Given user-inputted RF or IQ ultrasound data, this feature runs spectral analysis as described in the following studies (link here). If the ultrasound machine is supported, the app automatically pairs the image with a compatible phantom image. Otherwise, one must be provided by the user. Results and parametric maps are formed for the midband fit (MBF), spectral slope (SS), and spectral intercept (SI) spectral parameters.
2D Tissue Characterization for RF and IQ Data
2D CEUS Analysis with Motion Correction
Given user-inputted videos of 2D CEUS images and a user-drawn region of interest (ROI), this feature first runs Thodsawit's 2D motion correction algorithm as described here (link to paper here). A time intensity curve is then computed, and a lognormal curve is fitted and displayed. Finally, area under the curve (AUC), peak enhancement (PE), mean transit time (MTT), time to peak (TP), TMPPV (find what it stands for), and region area are calculated and displayed. For computers with high computational power, a parametric map of each parameter can be generated as well.
Given user-inputted videos of 3D CEUS images and a user-drawn volume of interest (VOI), this feature computes and displays a time intensity curve. Next, users can manually edit the time intensity curve to adjust for possible movement in the inputted CEUS video. A lognormal curve is then fitted to the editted curve and is displayed. Finally, area under the curve (AUC), peak enhancement (PE), mean transit time (MTT), time to peak (TP), TMPPV (find what it stands for), and VOI volume are calculated and displayed. For computers with high computational power, a parametric map of each parameter can be generated as well.
3D CEUS Analysis with Manual Motion Correction